Answers of long question from PYQ Paper Biostatistics and Bioinformatics of the years 2020, 2021 & 2022 respectively.
Table of Contents
Biostatistics 2020
3.a) Explain with suitable diagrams how can you correlate outliers with different types of kurtosis.
Ans→ Outliers are data points that significantly differ from other observations in a dataset.
Correlation of outliers with different types of Kurtosis:
Leptokurtic: Distribution with positive Kurtosis (>3) have heavy tails and sharp peak.
Outliers: The distribution has more outliers in the tails due to heavy tailed nature.
Mesokurtic: Distribution with positive Kurtosis equivalent to 3 has moderate tails and medium peak.
Outliers: The distribution has moderate numbers of outliers due to normal tail.
Platykurtic: Distribution with negative Kurtosis (<3) have light tails and a flat peak.
Outliers: These distributions tend to have fewer outliers due to light long tailed nature.
b) In dogs black coat colour (B) is dominant over yellow coat colour (b) and straight fur (S) is dominant over curly fur (s). The coat colour gene and the fur texture gene are located in assort independently different chromosomes, so they are not sex linked. In a cross between two BbSs parents, predict the fraction of offspring with black coat colour and straight fur.
Ans→ Each parent has the genotype BbSs where-
B (black) is the dominant allele over b (yellow)for coat colour and S (straight) is the dominant allele over s (curly) for fur texture.
1. Coat Colour: Each parent can produce gametes either B or b.
The punnett square for coat colour is-
| B | b | |
| B | BB | Bb |
| b | Bb | bb |
Black coat (BB & Bb) =1/4 + 2/4 = 3/4
Yellow coat (bb) = 1/4
2. Fur texture: Each parent can produce gametes either S or s .
The punnett square is for fur colour is
| S | s | |
| S | SS | Ss |
| s | Ss | ss |
Straight fur (SS & Ss) = 1/4 + 2/4 = 3/4
Curly fur (ss) =1/4
Probability of offspring with be both black coat and straight for is the multiplication of both probability of black coat and straight fur :
-Probability of Black coat colour and straight fur= ¾ × ¾ = 9/16
The fraction of offspring with black coat colour and straight fur is between two BbSs parents is 9/16.
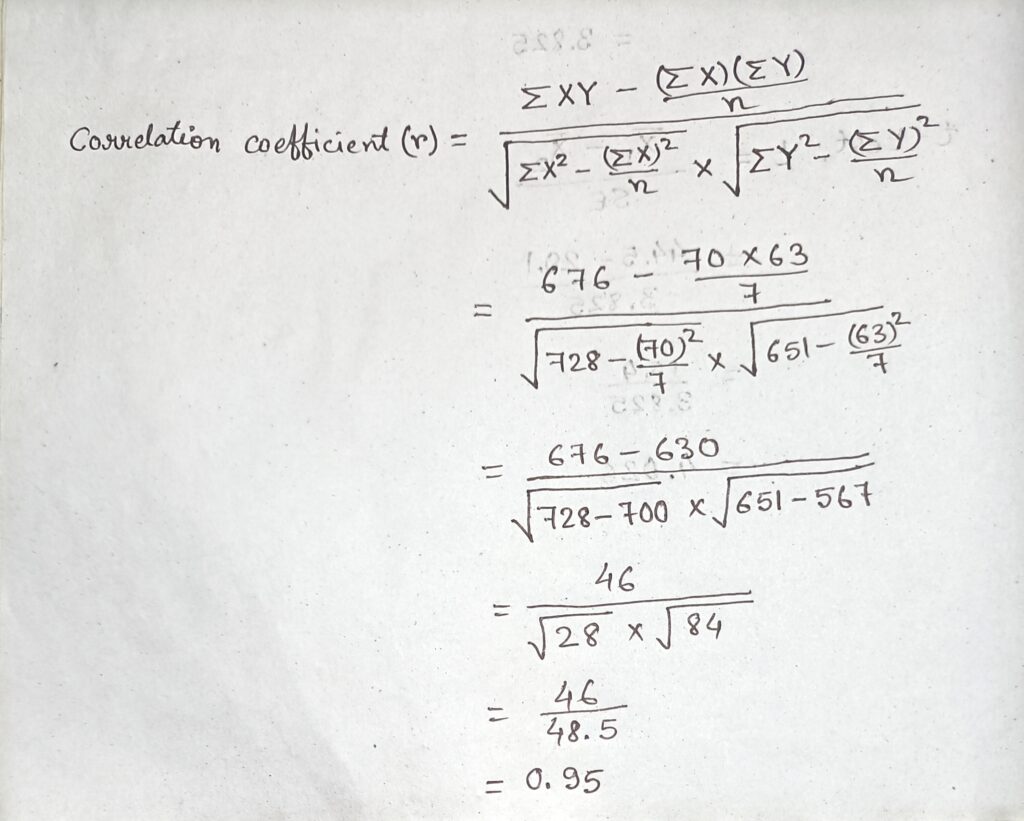
c) Calculate the correlation coefficient from the following data set and comment on the relationship between X and Y.
| X | 12 | 9 | 8 | 10 | 11 | 13 | 7 |
| Y | 14 | 8 | 6 | 9 | 11 | 12 | 3 |
Ans→
| X | Y | X2 | Y2 | XY |
| 12 | 14 | 144 | 196 | 168 |
| 9 | 8 | 81 | 64 | 72 |
| 8 | 6 | 64 | 36 | 48 |
| 10 | 9 | 100 | 81 | 90 |
| 11 | 11 | 121 | 121 | 121 |
| 13 | 12 | 169 | 144 | 156 |
| 7 | 3 | 49 | 9 | 21 |
| ΣX=70 | ΣY=63 | ΣX2 = 728 | ΣY2=651 | ΣXY=676 |

Biostatistics 2021
3.a) Write down the usage of the chi-square test? What are primary biological databases? Give an example.
Ans→ 1. Test of Independence: To determine if there is a significant association between two categorical variables. Used to make a contingency table to test the relationship between them.
2. Goodness of fit: To assess whether observed frequencies match expected frequencies based on specific hypothesis.
3. Genetics: To test hypothesis about genetic inheritance patterns used to compare genotypic frequencies with expected frequencies under Mendelian inheritance.
4. Used to check quality control: To check the conformity of product quality to specified standards is an industrial process to check defect frequency is within acceptable limits.
Primary biological Database: Primary biological databases are the databases that collect and store raw experimental data from biological research.
Example: GenBank, PDB, Array Express.
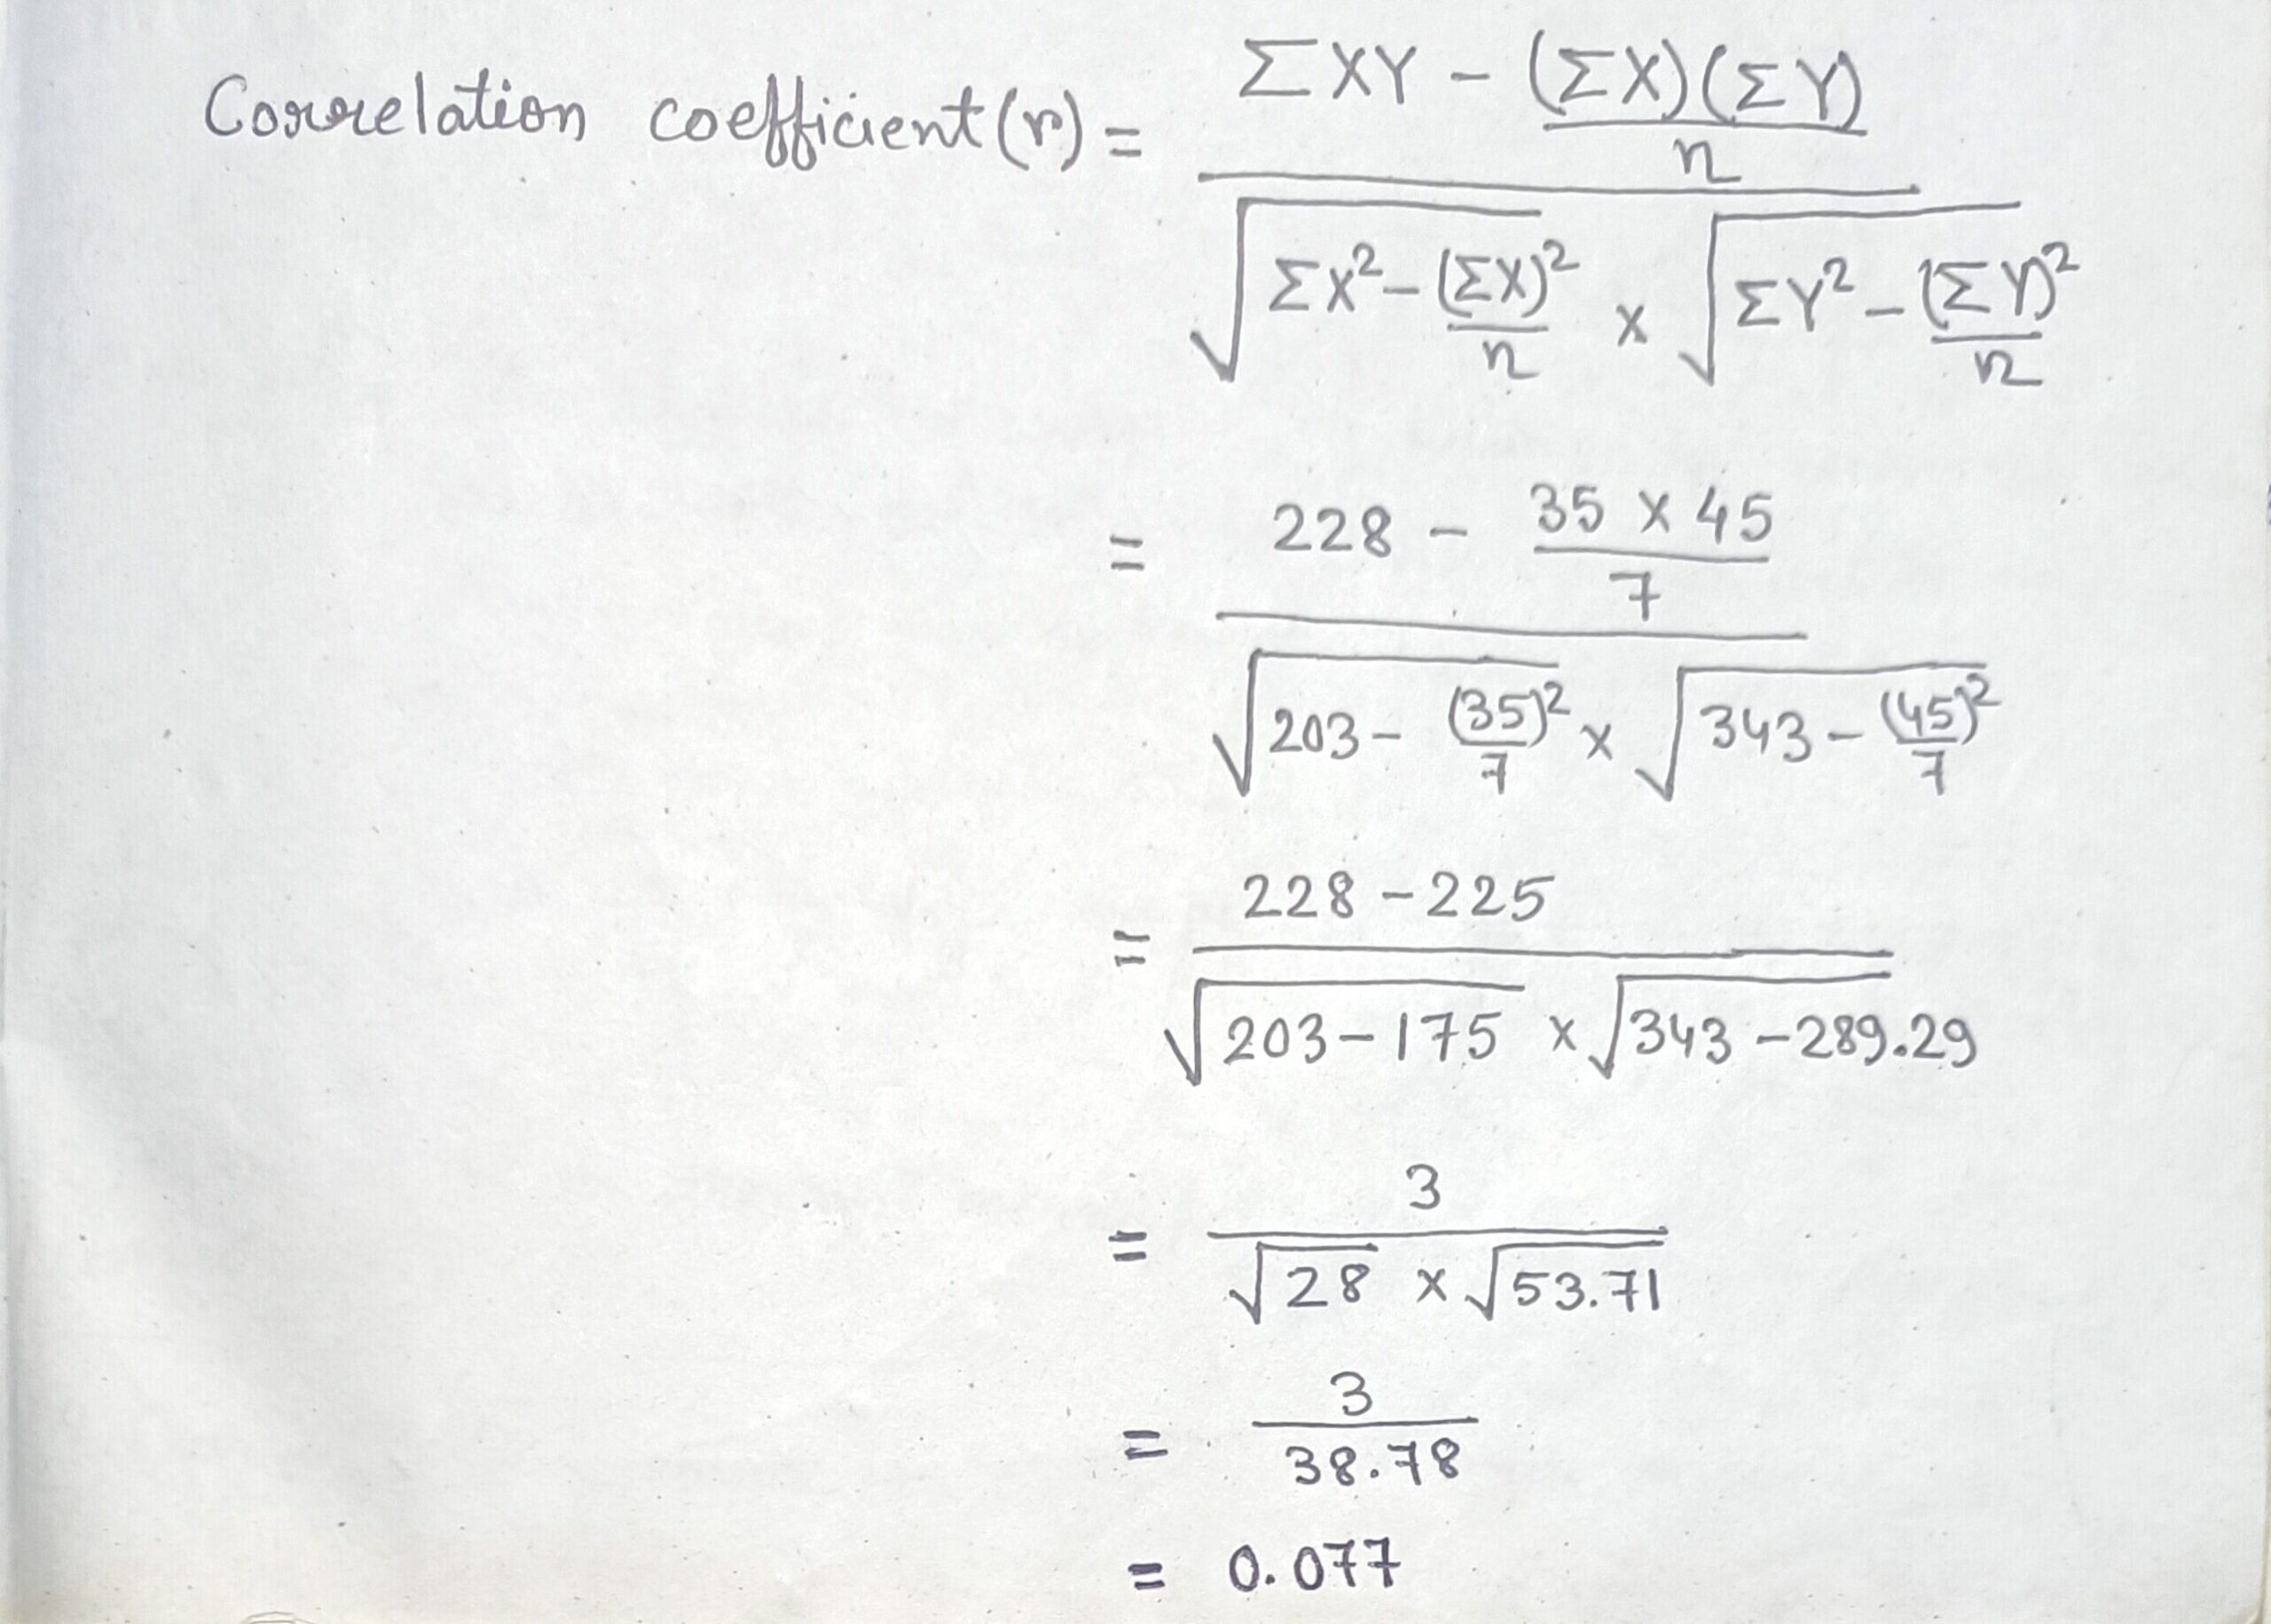
b) Calculate the correlation coefficient from the following data set and comment on the relationship between X and Y.
| X | 2 | 3 | 4 | 5 | 6 | 7 | 8 |
| Y | 4 | 5 | 6 | 12 | 9 | 5 | 4 |
Ans→
| X | Y | X2 | Y2 | XY |
| 2 | 4 | 4 | 16 | 8 |
| 3 | 5 | 9 | 25 | 15 |
| 4 | 6 | 16 | 36 | 24 |
| 5 | 12 | 25 | 144 | 60 |
| 6 | 9 | 36 | 81 | 54 |
| 7 | 5 | 49 | 25 | 35 |
| 8 | 4 | 64 | 16 | 32 |
| ΣX= 35 | ΣY= 45 | ΣX2= 203 | ΣY2= 343 | ΣXY= 228 |

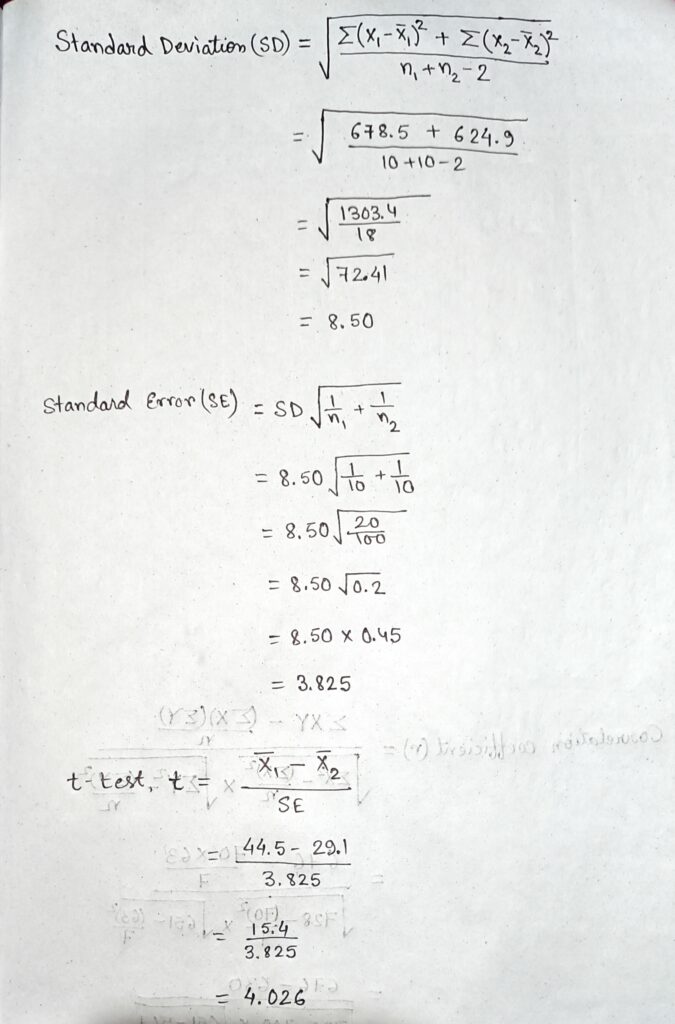
c) A research study was conducted to examine the differences between older and younger on perceived life satisfaction. A pilot study was conducted to examine the hypothesis. Ten olders (over the age of 70) and ten younger (between 20-30) were given a life satisfaction test (known to have high reliability and validity). Scores on the measure range from 0-60 with high scores indicative of highlife satisfaction; low scores indicative of low life satisfaction.
1. Compute the appropriate t-test
2. What will be the null hypothesis in this study
3. What will be the alternative hypothesis ?
| Older | 45 | 38 | 52 | 48 | 25 | 39 | 51 | 46 | 55 | 46 |
| Younger | 34 | 32 | 15 | 27 | 37 | 41 | 24 | 19 | 26 | 36 |
Ans→
| Older – X1 | X1 – X̄1 | ( X1 – X̄1 )2 | Younger – X2 | X2 – X̄2 | ( X2 – X̄2 )2 |
| 45 | 0.5 | 0.25 | 34 | 4.9 | 24.01 |
| 38 | -6.5 | 42.25 | 32 | 2.9 | 8.41 |
| 52 | 7.5 | 56.25 | 15 | -14.1 | 198.81 |
| 48 | 3.5 | 12.25 | 27 | -2.1 | 4.41 |
| 25 | -19.5 | 380.25 | 37 | 7.9 | 62.41 |
| 39 | -5.5 | 30.25 | 41 | 11.9 | 141.61 |
| 51 | 6.5 | 42.25 | 24 | -5.1 | 26.01 |
| 46 | 1.5 | 2.25 | 19 | -10.1 | 102.01 |
| 55 | 10.5 | 110.25 | 26 | -3.1 | 9.61 |
| 46 | 1.5 | 2.25 | 36 | 6.9 | 47.61 |
| Σ X1 = 445 | Σ(X1 – X̄1)2 = 678.5 | Σ X2 = 291 | Σ(X2 – X̄2)2 = 624.9 |
X̄1 = 445/10
= 44.5
X̄2 = 291/10
= 29.1

Biostatistics 2022
3.a) Differentiate the following pairs: (i) Nominal and ordinal scale (ii) Internal and Ratio scale
Ans→
| Points | Nominal Scale | Ordinal Scale |
| 1. Definition | A nominal scale catagorizes data without any order, using labels or names of classification. | A ordinal scale catagorizes data with meaningful order, ranking categories in sequence. |
| 2. Order | No intrinsic ordering between categories. | Logical order or ranking between categories. |
| 3. Mathematical operation | Limited to counting and mode calculation. | Allows for counting mode, median and rank order operation. |
| 4. Statistics | Uses frequency distributions chi square test. | Uses non- parametric test like Spearman rank correlation. |
| 5. Examples | Types of fruits (oranges, apples, grapes) | Movie ratings ( poor, fair, good, excellent) |
| Points | Interval Scale | Ratio Scale |
| 1. Definition | Interval scale measures variables with equal intervals between values but no true zero point. | Ratio Scale measures variables with equal intervals and a true zero point. |
| 2. Zero point | Has an arbitrary attribute | Has a true zero point. |
| 3. Ratio comparison | Ratios are not meaningful. | Ratios are meaningful |
| 4. Examples | Temperature in Centigrade or Fahrenheit, Calendar years | Length, mass, duration, temperature in Kelvin scale. |
b) (i) Computer the mean, variance and standard deviation of plant body heights (cm) of the following distribution:
Ans→
| Plant body height in cm | No of plants (f) | Mid value (x) | fx | (x – x̄) | (x – x̄)2 | f(x – x̄)2 |
| 156 – 160 | 04 | 158 | 632 | 10.0833 | 101.6729 | 406.6916 |
| 161 – 165 | 14 | 163 | 2282 | 5.0833 | 25.8399 | 361.7586 |
| 166 – 170 | 25 | 168 | 4200 | 0.0833 | 0.0069 | 0.1725 |
| 171 – 175 | 11 | 173 | 1903 | 4.9167 | 24.1739 | 265.9129 |
| 175 – 180 | 06 | 178 | 1068 | 9.9167 | 98.3409 | 590.0454 |
| Σ f = 60 | Σ fx = 10085 | Σf(x – x̄)2 =1624.581 |
Mean (x̄) = Σfx / Σf
= 10085 / 60
(x̄) = 168.0833
Variance = Σf(x – x̄)2 / Σn [n= f =60]
= 1624.581 / 60
= 27.0763
Standard Deviation(SD)
= √(variance)
= √(27.0763)
= 5.2035
(ii) A proportion of 0.3 of the patients of a psychological disorder is known to be cured by a course of psychiatric treatment. Find the probability of cure of 3 patients of a sample of 7 patients.
Ans→ The proportion of cure person is = 0.3
Then, the proportion of uncured person is (1 – 0.3) = 0.7
Now, the probability of cure of 3 patients of a sample 7 patients is
P = n! × (p)S × (q)T / ( S! × T! )
= 7! × (0.3)3 × (0.7)4 / (3! × 4! )
= 7×6×5×4×3×2×1 × 0.27 × 0.24 / (3×2×1 × 4×3×2×1)
= 35 × 0.027 × 0.24
= 0.2268
| P | Probability | |
| n | No. of events (total no. of person) | 7 |
| p | Proportion of cured person | 0.3 |
| q | Proportion of uncured person | 0.7 |
| S | No. of cure person | 3 |
| T | No. of uncured person | 4 |
c) Suppose the two heterozygous individuals Pp and Pp are crossed (where P is the common allele and p is the recessive congenital analgesia allele). What will be the probability that the first offspring will be unaffected, second offspring will have congenital analgesia and the third offspring will be unaffected?
Ans→ The possible genotypes of the offspring and their corresponding probabilities are:
PP (unaffected)
Pp (unaffected, carrier)
pp (affected, has congenital analgesia)
From the Punnett square, the probabilities of each genotype are:
| P | p | |
| P | PP | Pp |
| p | Pp | pp |
PP: 1/4
Pp: 2/4
pp: 1/4
For this problem,
Unaffected (PP, Pp) = 1/4 + 2/4 = 3/4
Affected (pp) = 1/4
Since these events are independent, the combined probability is the product of the individual probabilities
P ( unaffected1, affected2, unaffected3 ) = ¾ × ¼ × ¾
= 9/64
Probability of the first offspring will be unaffected, second offspring will have congenital analgesia and the third offspring will be unaffected is 9/64.
Developmental Biology Shorts PYQ Developmental Biology Long PYQ

The answer of pyq 3.b,2021 of bio statistics is wrong .please correct this. The answer you put there is the answer of pyq 3.c ,2020
Sorry…I apologize for my mistake. Thanks to you for recognition the mistake and help me to correct this.
very helpful website for skbu , zoology students